
Photo by PlanetCare on Unsplash
Introduction
Anecdotal data based on conversations with some of my friends suggested that their electricity bill had doubled to what was expected. In Oct 2022, the inflation in Belgium was peaking a 10-year high at 12.2% [1]. However, it was not until January-February 2023, that many of my friends received their yearly electricity consumption invoice, so it was a sudden sock to see the impact on energy usage bill. This was not a lone incident, such trends were observed in many homes in Belgium [2].
“The IEA’s results [3] were corroborated by another study published earlier this year by Eurostat [4], the EU’s official statistics office, which found that Belgian households paid the most for electricity in the EU in the second half of 2022, second only to Denmark”.
– The Brussels Times [2]
This prompted me to try to understand and estimate my energy consumption. However, since I was already tracking my apartment’s overall energy consumption with the building’s electricity meter, I thought it would be more interesting to try to understand which of the appliances in my apartment consume more electricity. One possible solution was that I could just read the energy labels [5] of the appliances to make an estimate, but where’s the fun in that?
An alternative was that I could purchase a digital energy meter and track the energy consumption of common household appliances myself. Easier said than done, a proper tracking of electricity consumption of many appliances in a controlled manner turned out to be tricky. There were many variables and parameters that affected the energy consumption of these appliances so a controlled study was not so simple. For example, the energy usage of a fridge would not only depend on the machinery but also on how many times you open the door and the ambient temperature; Another example could be for ovens, where the energy usage will depend on the set temperature and duration of oven use for baking bread, pizza, quiche, or simply how hungry I was on that day. Tracking the energy usage of my TV would be fairly simple, but who wants to get up in the middle of watching a documentary to record the electricity consumption readings every hour; besides, there were no variable parameters that I could change and design an experiment to see how the energy usage of the TV changed, other than the brightness settings. The only appliance I found to have the possibility for measuring the energy consumption in a controlled manner, albeit limited, with multiple variables that I could track was the washing machine. So in mid 2023, I purchased a digital meter to measure the electricity consumption of any appliance that is plugged-in with it, and study the electricity consumption of my washing machine.
The purpose of this article is simply to understand the operations of energy consumption of my washing machine and to have fun while doing the measurements and the analysis. Based on the conclusions of this study, certain generalization can be made for other washing machines, however, to determine the exact details, it is imperative to measure the energy consumption of that specific machine as there are several factors that can affect the numbers (age of the machine, environment, water quality, type of clothes washed etc.).
If you are curious about the results, you can skip the experimental procedure and directly jump to the results and analysis section.
Experimental procedure
Apparatus used
I used my washing machine Samsung WW91TA049TH EcoBubble [6] for the purpose of this experiment. The equipment was recently purchased, September 2022, and so, the age of the machine for the duration of this experiment was in the range of 10 months to 17 months. The energy class of this model reads “A”, and is based on the new energy class system [7]. More details on the energy class for washing machines can be found here [8].
To measure the energy consumption of the washing machine, I used a digital energy meter by Hilllar [9]. It is a simple device which is directly plugged into the socket and has the possibility to then accept the plugging-in of the washing machine into it. It can be used to record the duration, real-time energy flow rate or power (W), total energy consumption during the entire measurement period, highest and the lowest value of the power and a direct conversion to the cost of the energy consumed.
To measure the weight of the dry clothes before adding them to the washing machine, I used a digital weighing scale, PS400 by Medisana [10].
Measurement methodology
For each washing cycle, the dry clothes were first weighted, and then introduced into the washing machine. Since the weight of the laundry could potentially impact the energy consumption of the machine, the weighing was essential. Before running each cycle, the digital energy meter was reset, to clear the readings from the previous washing cycle, and to record the energy measurements of the current washing cycle. After the completion of each washing cycle, the measurements from the energy meter were recorded: the duration and the total energy consumption of that washing cycle. Each washing cycle started with dry tumbling of clothes, followed by wetting along with the introduction of the detergent, wash tumbling and soaking (in certain programs), rinsing and the final spin drying to remove excess water. The washing cycle did not include drying of the clothes with heat.
The washing machine has multiple modes for washing that can be selected for different cloth types and washing methods, as shown in the figure 1. Since each washing mode works differently and uses electricity in different ways, to control for this variability, the only washing mode that was used in this experiment was “Gemengde was/Charge Mixte”, which is Dutch/French for “Mixed laundry”, meant to handle different types of clothes in a single wash cycle. After selecting the Mixed laundry mode, it was possible to modify the set temperature of the water to be used during the washing cycle from 20°C to 90°C. Therefore, the parameters that were controllably changed were water temperature and the weight of the clothes. Additionally, one more washing mode was used, called “Eco 40-60” [11], which is ideally meant for saving energy and water consumption. More details on this the Eco 40-60 mode can be found in the section below. This experimental plan is illustrated in the figure 2.
The experiments were run over the course of 8 months, and included washing of all kinds of clothes.
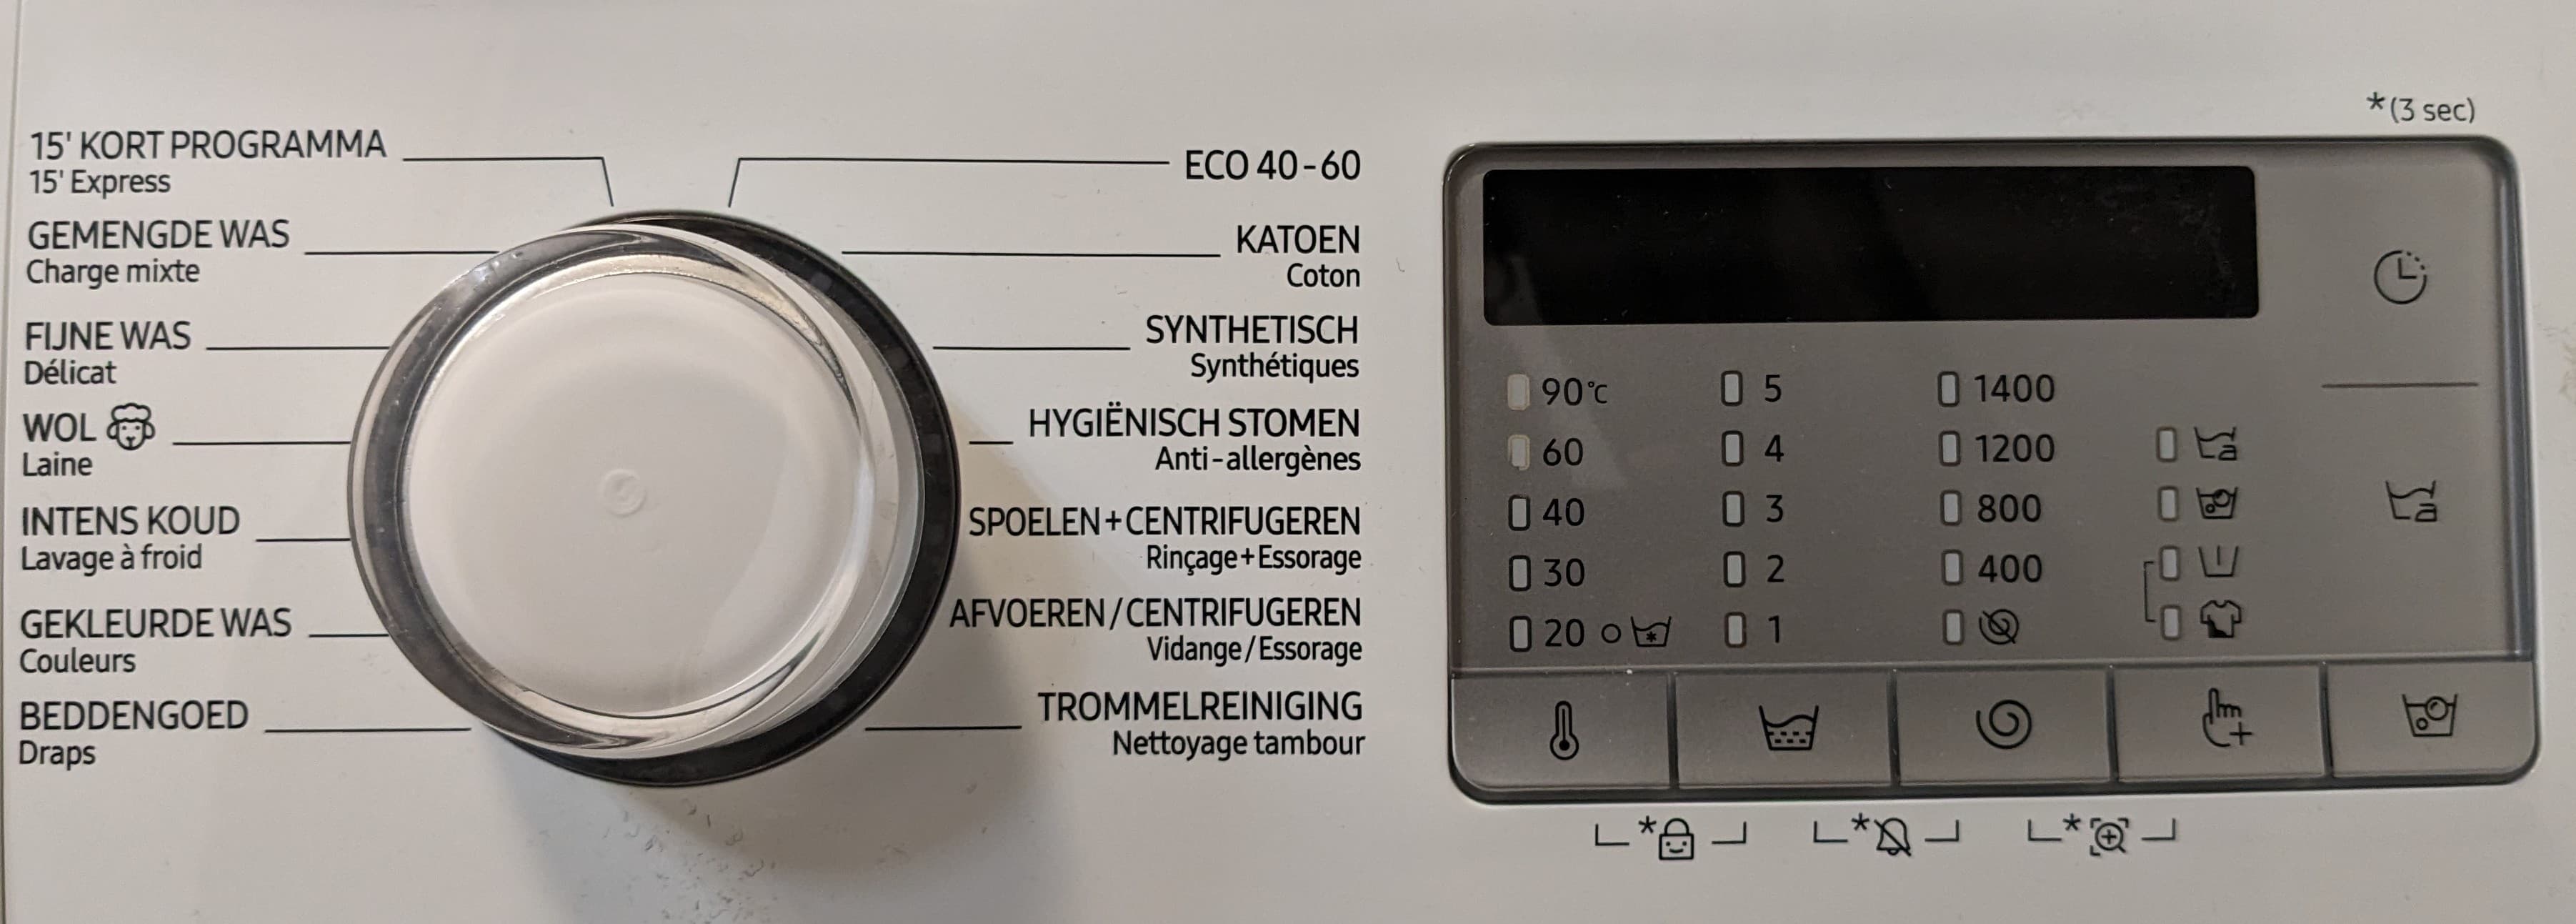
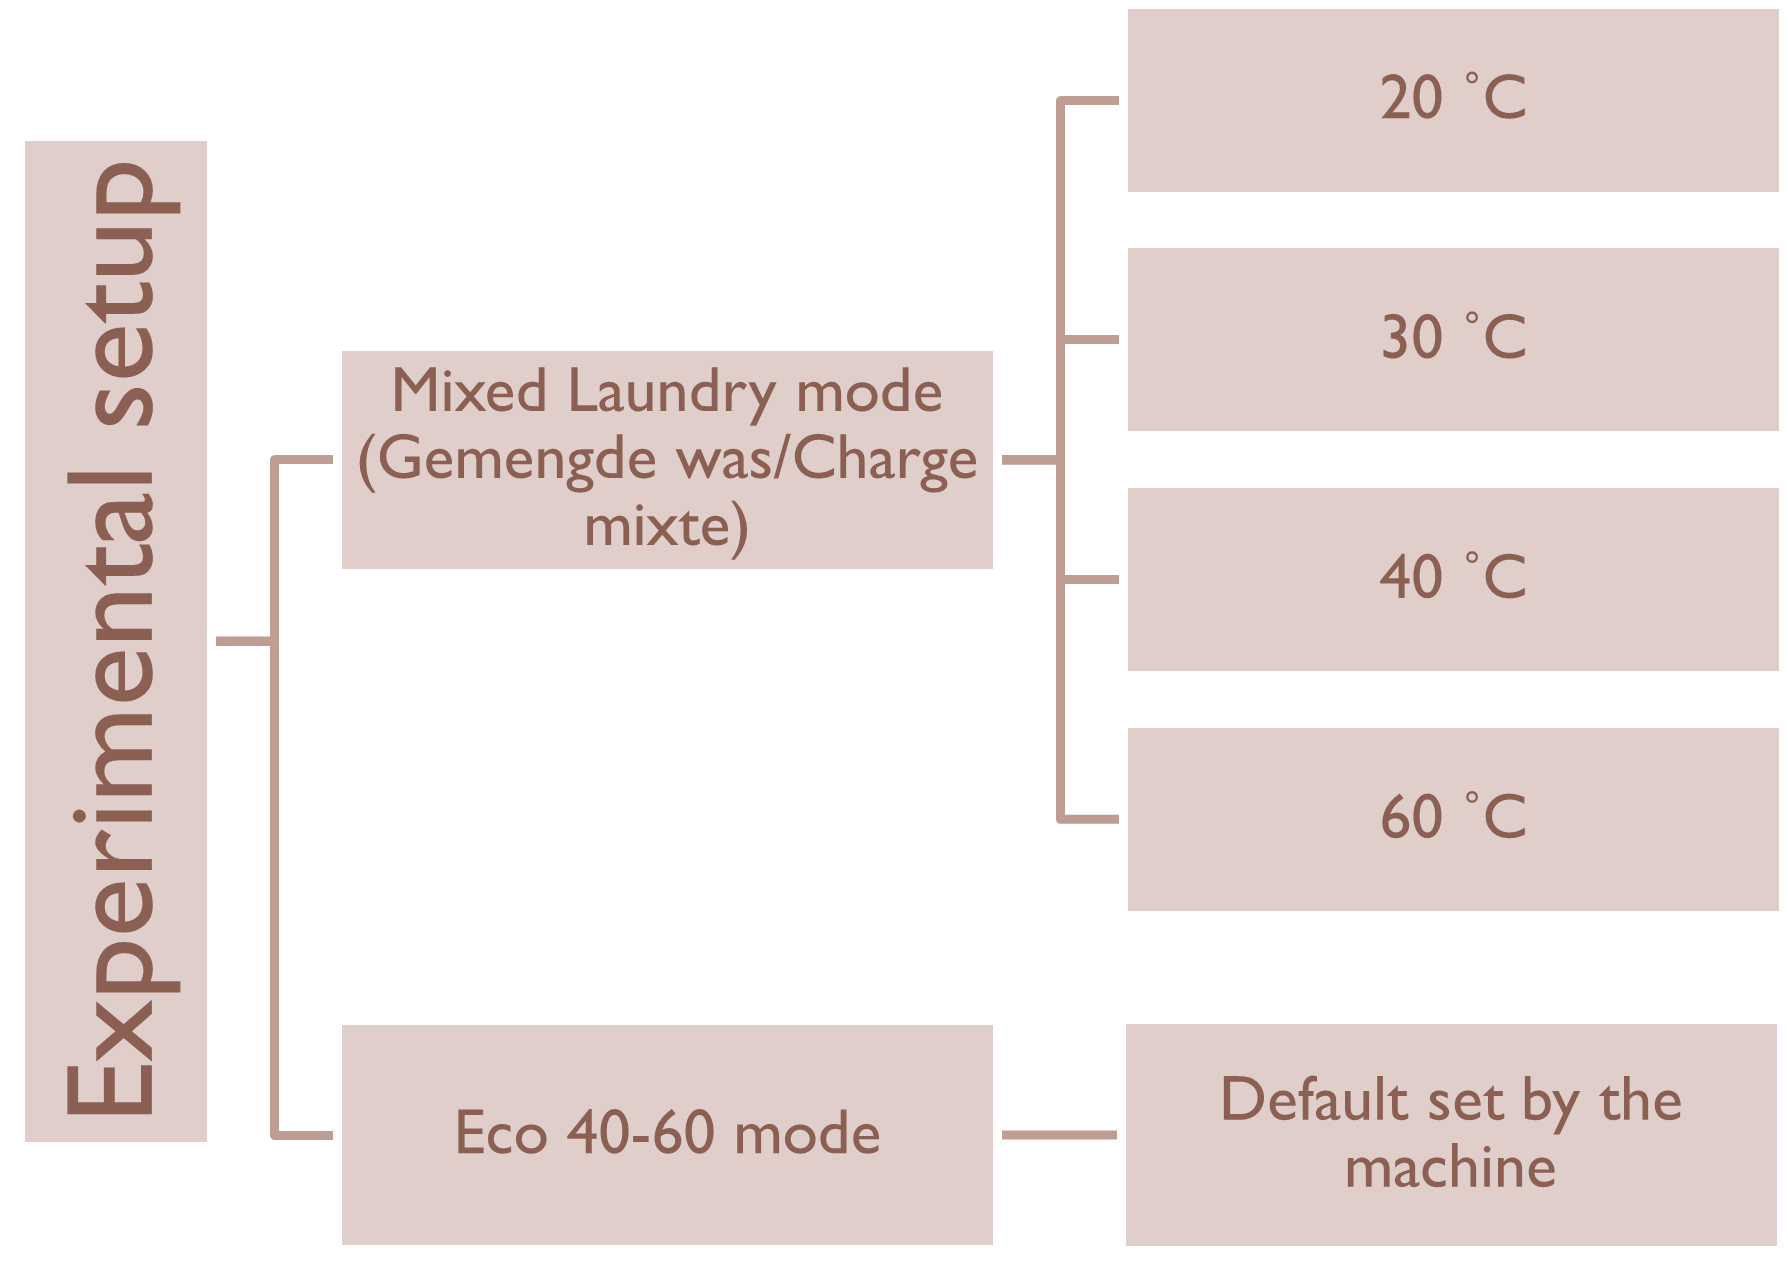
Figure 2: Schematic describing the experimental setup.
Definitions and the units
- Energy consumption: It refers to the amount of work done or electrical energy consumed during a specific duration of the process or a washing cycle in the context of this article. The standard unit of energy is joules (J), however, in this case I am using the more commonly used unit (for electrical billing), kilowatt-hour (kWh).
- How much is 1 kWh: Think about a typical microwave of power rating of 1000 W, if ran continuously for 1 hour will consume electrical energy of 1 kWh.
- The weight of the clothes is measured in kilograms (kg).
- The temperature of the water as set during the washing cycle by the machine was measured in degree Celsius (°C).
Results and analysis
Impact of the weight of the clothes/laundry
The impact of the weight of the clothes for laundry on the energy consumption is shown in figure 3. As previously mentioned, when using the Mixed laundry mode, it was possible to modify the set water temperature from 20°C to 90°C. Hence, multiple experiments were run for each water temperature (except 90°C) while varying the laundry weight. Each dot in figure 3 represents one washing cycle. As can be observed in figure 3, for the washing cycles that used lower water temperatures, the weight of the laundry had negligible impact, while for the washing cycles that used higher water temperatures, with the increase in the weight of the laundry, the energy consumption also increased.
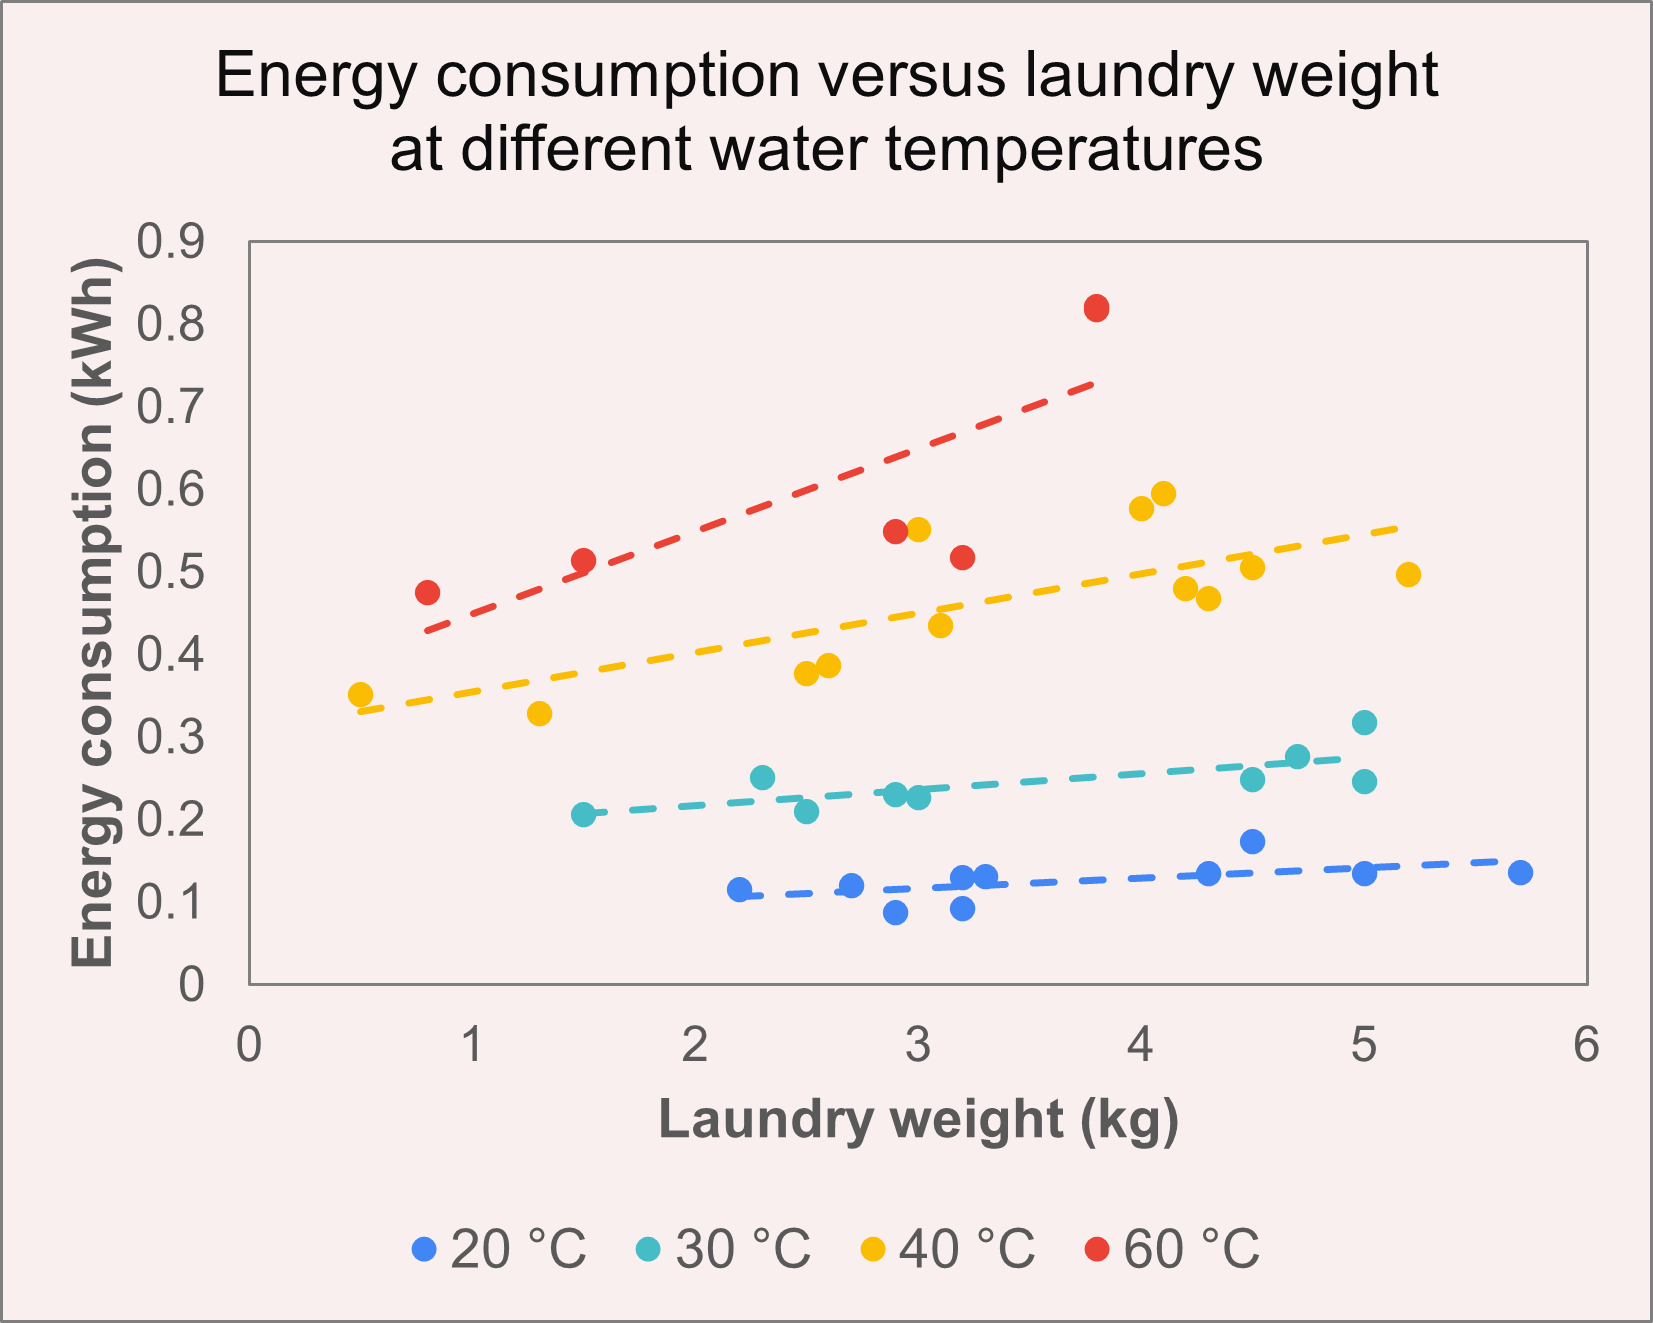
Figure 3: The graph shows the energy consumption per cycle with increase in laundry weight for each set water temperature used. Each dot represents 1 washing cycle. For lower water temperatures (20°C or 30°C), the laundry weight has negligible impact on the energy consumption, but when the washing cycle uses higher water temperature (40°C and 60°C), the energy consumption increases with increase in laundry weight. The dashed line represents a linear fit to the scatter plot for each temperature.
Impact of the water temperature
The highest contribution to energy consumption can be attributed to using higher water temperature, as can be inferred from figure 4. When using the Mixed laundry mode, selecting 60°C instead of 20°C for the water temperature can result in 400% higher energy consumption to supply the hot water. Additionally, as was noted from figure 3, the laundry weight has a higher impact on energy consumption when using 60°C compared to 20°C, this also resulted in larger error bars in the figure 4, because the bar graph includes the mean of many washing cycles without a control on the laundry weight.
Therefore, more energy can be saved by switching to lower water temperatures during the wash.
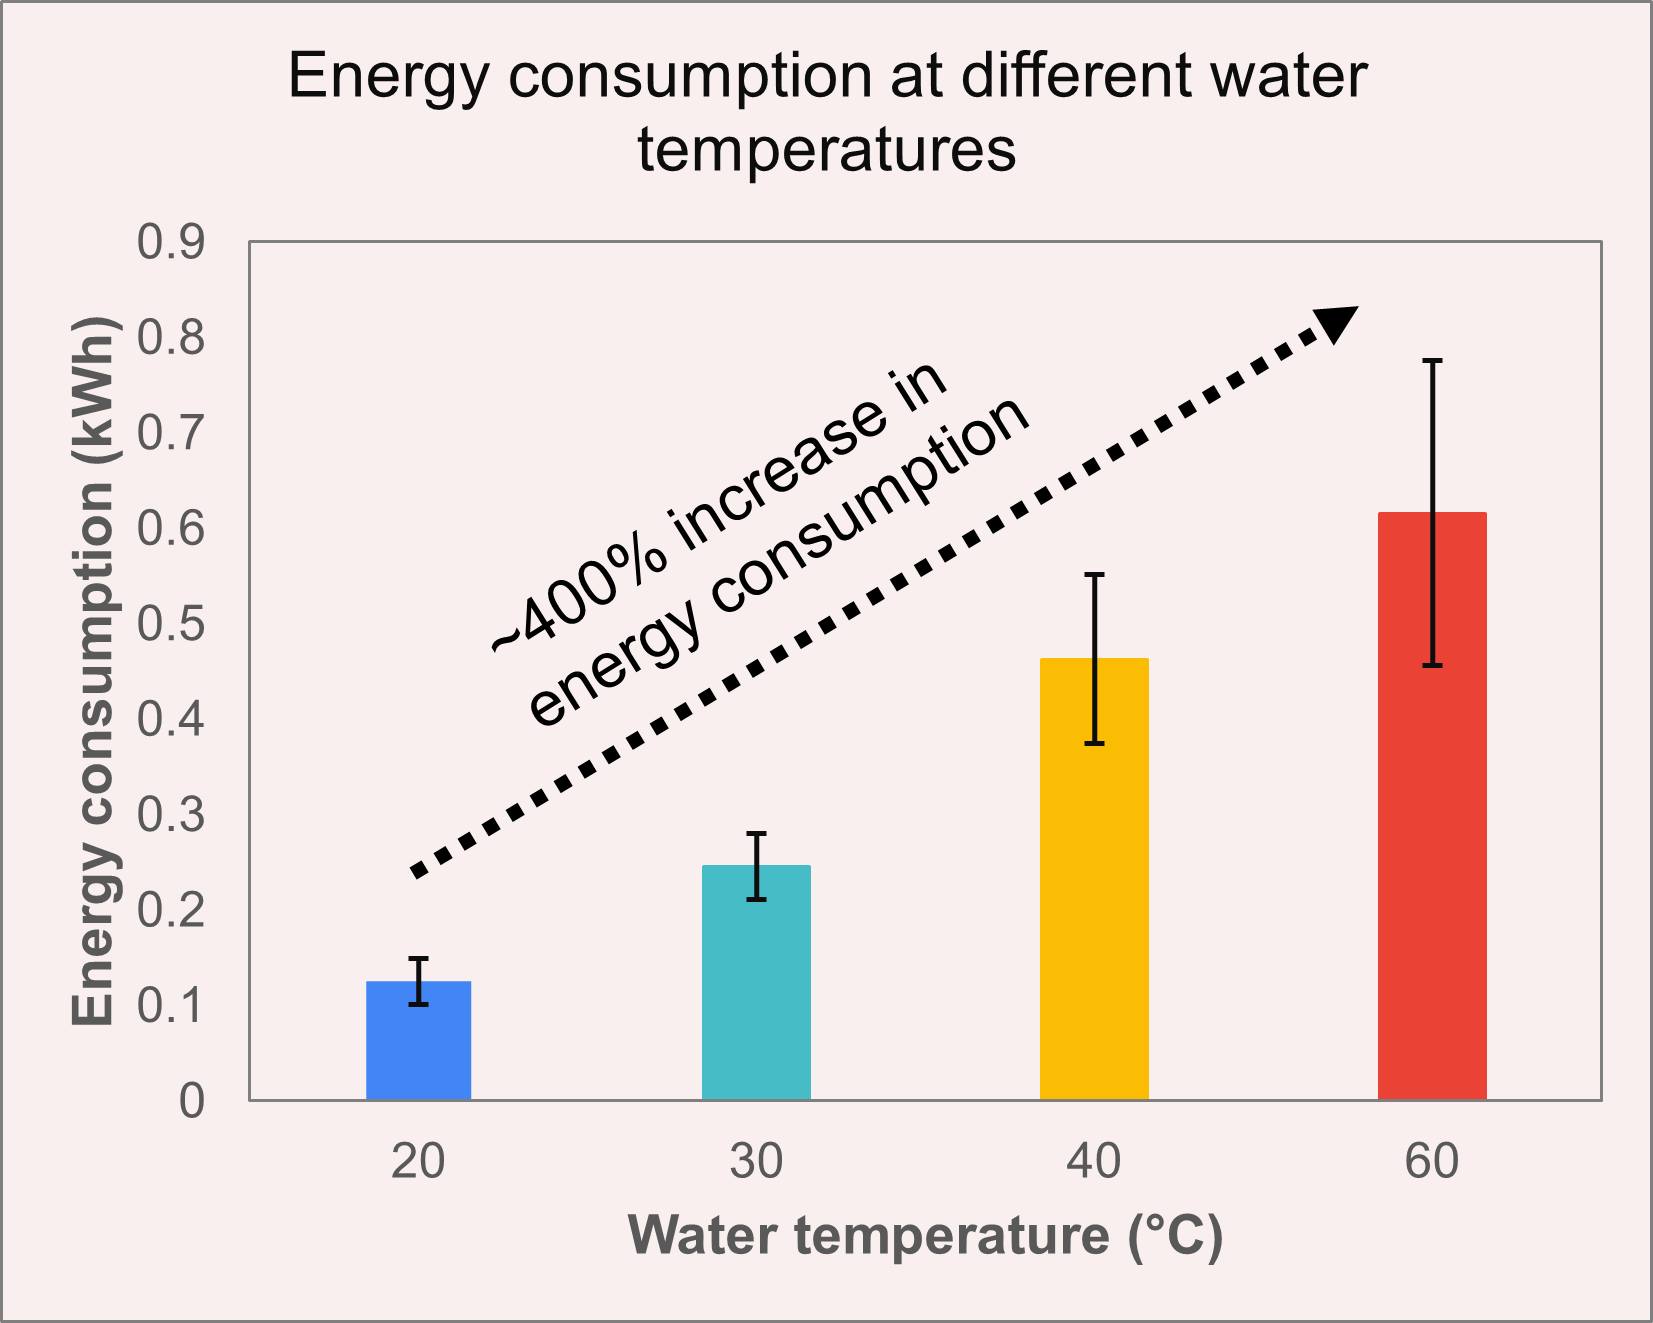
Figure 4: The graph shows the mean energy consumption per cycle (using the Mixed Laundry mode) with increase in the set water temperature used for that cycle. Each bar chart is a mean of at least 6 washing cycles (with variable laundry weight), and the error bars representing the standard deviation due to variation in the laundry weight.
Eco 40-60 mode
As mentioned by Testaankoop [12], the “Eco 40-60” is the name of the mandatory eco program that is present on all new washing machines to meet the requirements for the new EU energy label.” This program mode is meant to conserve both electricity as well as water usage. The name Eco 40-60, can be confusing, as it may seem (incorrectly) that the program includes 2 washing cycles, one at 40°C and one at 60°C, however that is not correct. For the Eco 40-60 program the idea is that both laundry for 40°C and laundry for 60°C can be washed with this one program, as explained by consumentenbond [11]. The trade-off this program makes for not using high water temperature is increased soaking time.
As can be observed from figure 5, Eco 40-60 program consumed less energy than the 30°C Mixed laundry program but more than 20°C Mixed laundry program. It must be noted that Eco 40-60 program may not always be the low-energy consuming mode, as noted by Testaankoop [12], as it may depend on the washing machine energy label. However, in this case, as the energy label for my machine is A, the Eco 40-60 mode did consume less energy.
So, should we always use the Eco 40-60 mode? The answer to that question may also depend on the next section below.

Figure 5: The graph shows the mean energy consumption per cycle using the Mixed Laundry mode (water temperature from 20°C to 60°C) versus the Eco 40-60 washing mode.
Washing duration per cycle
The amount of time consumed by Mixed laundry program (at any water temperature) is approximately one hour, however, for the Eco 40-60 mode it is about 2.5 hours. This is expected, because the Eco 40-60 mode trades off energy needed to heat the water by increased the soaking time for the laundry. This way Eco 40-60 program is expected to give similar washing performance as a 40°C or 60°C program, but with longer wash cycle duration (because of increased soak time).
So, if washing cycle duration is not a concern, it may be advisable to use Eco 40-60 mode as it consumes similar energy as 20°C Mixed laundry program. Additionally, Eco 40-60 program also saves on water by optimizing rinsing steps, as mentioned by consumentenbond [11], which, unfortunately, could not be tested in this study. If however, you need a quick wash cycle for not-so-dirty everyday clothes, it may still be alright to use 20°C Mixed laundry program instead of Eco 40-60, as you can get the laundry done in about one hour, but with the use of additional water compared to Eco 40-60 mode.
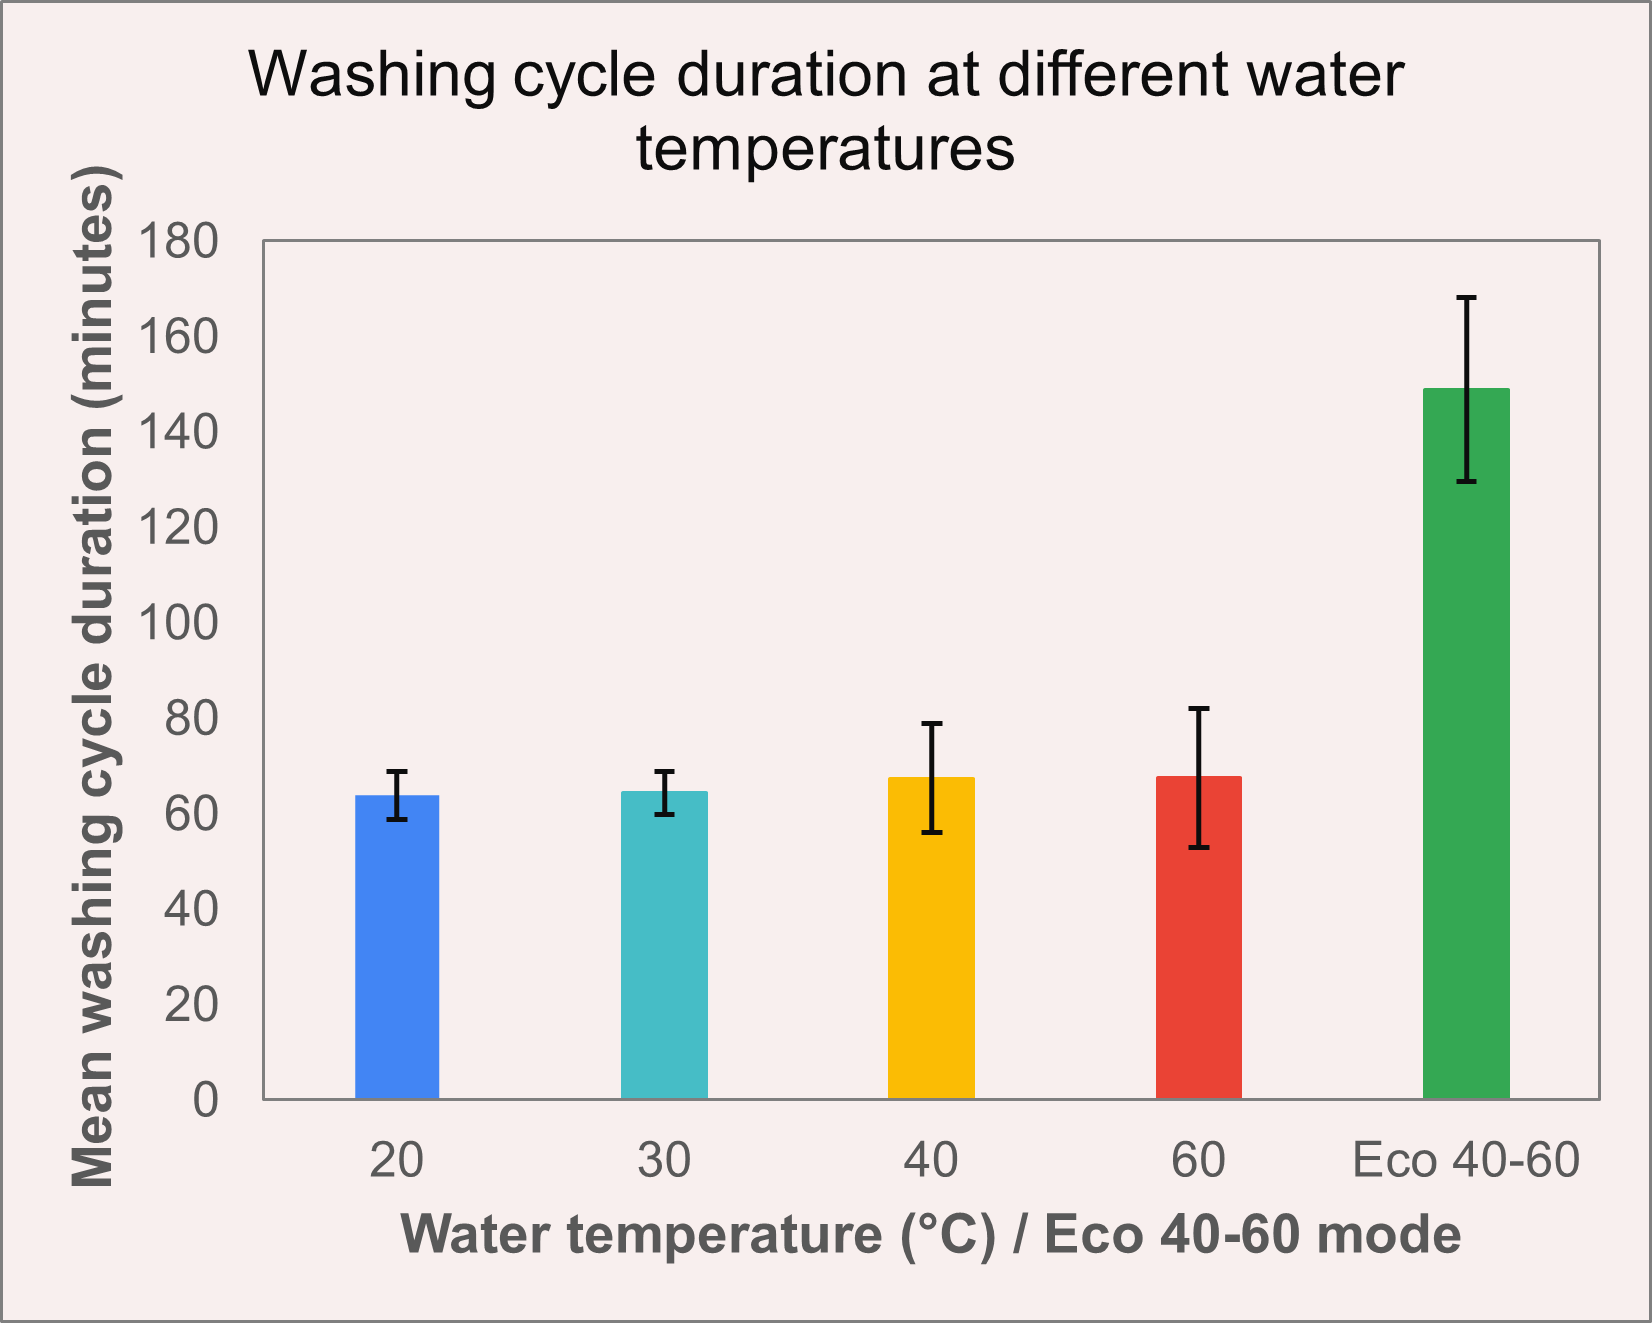
Figure 6: The graph shows the mean washing cycle duration using the Mixed Laundry mode (water temperature from 20°C to 60°C) versus the Eco 40-60 washing mode.
Cost analysis
To calculate the effective cost for different programs and temperature modes, the price reference value used was €0.4 per kWh, which roughly corresponds to the actual cost during the first half of 2023, as noted by Eurostat [13]. The figure 7 shows the cost for 200 washing cycles with the mentioned price reference value. To calculate the cost of 200 washing cycles, the price reference value (€0.4 per kWh) was multiplied by the energy consumption per cycle (figure 5), which was then multiplied by 200 washing cycles. As can be observed in figure 5, the higher temperature used, the more it costs due to higher electricity usage. Eco 40-60 mode shows comparable cost as 20°C cycle in Mixed laundry mode. However, as mentioned in the previous section, The Eco 40-60 mode saves not only electrical energy but also on water usage [11].
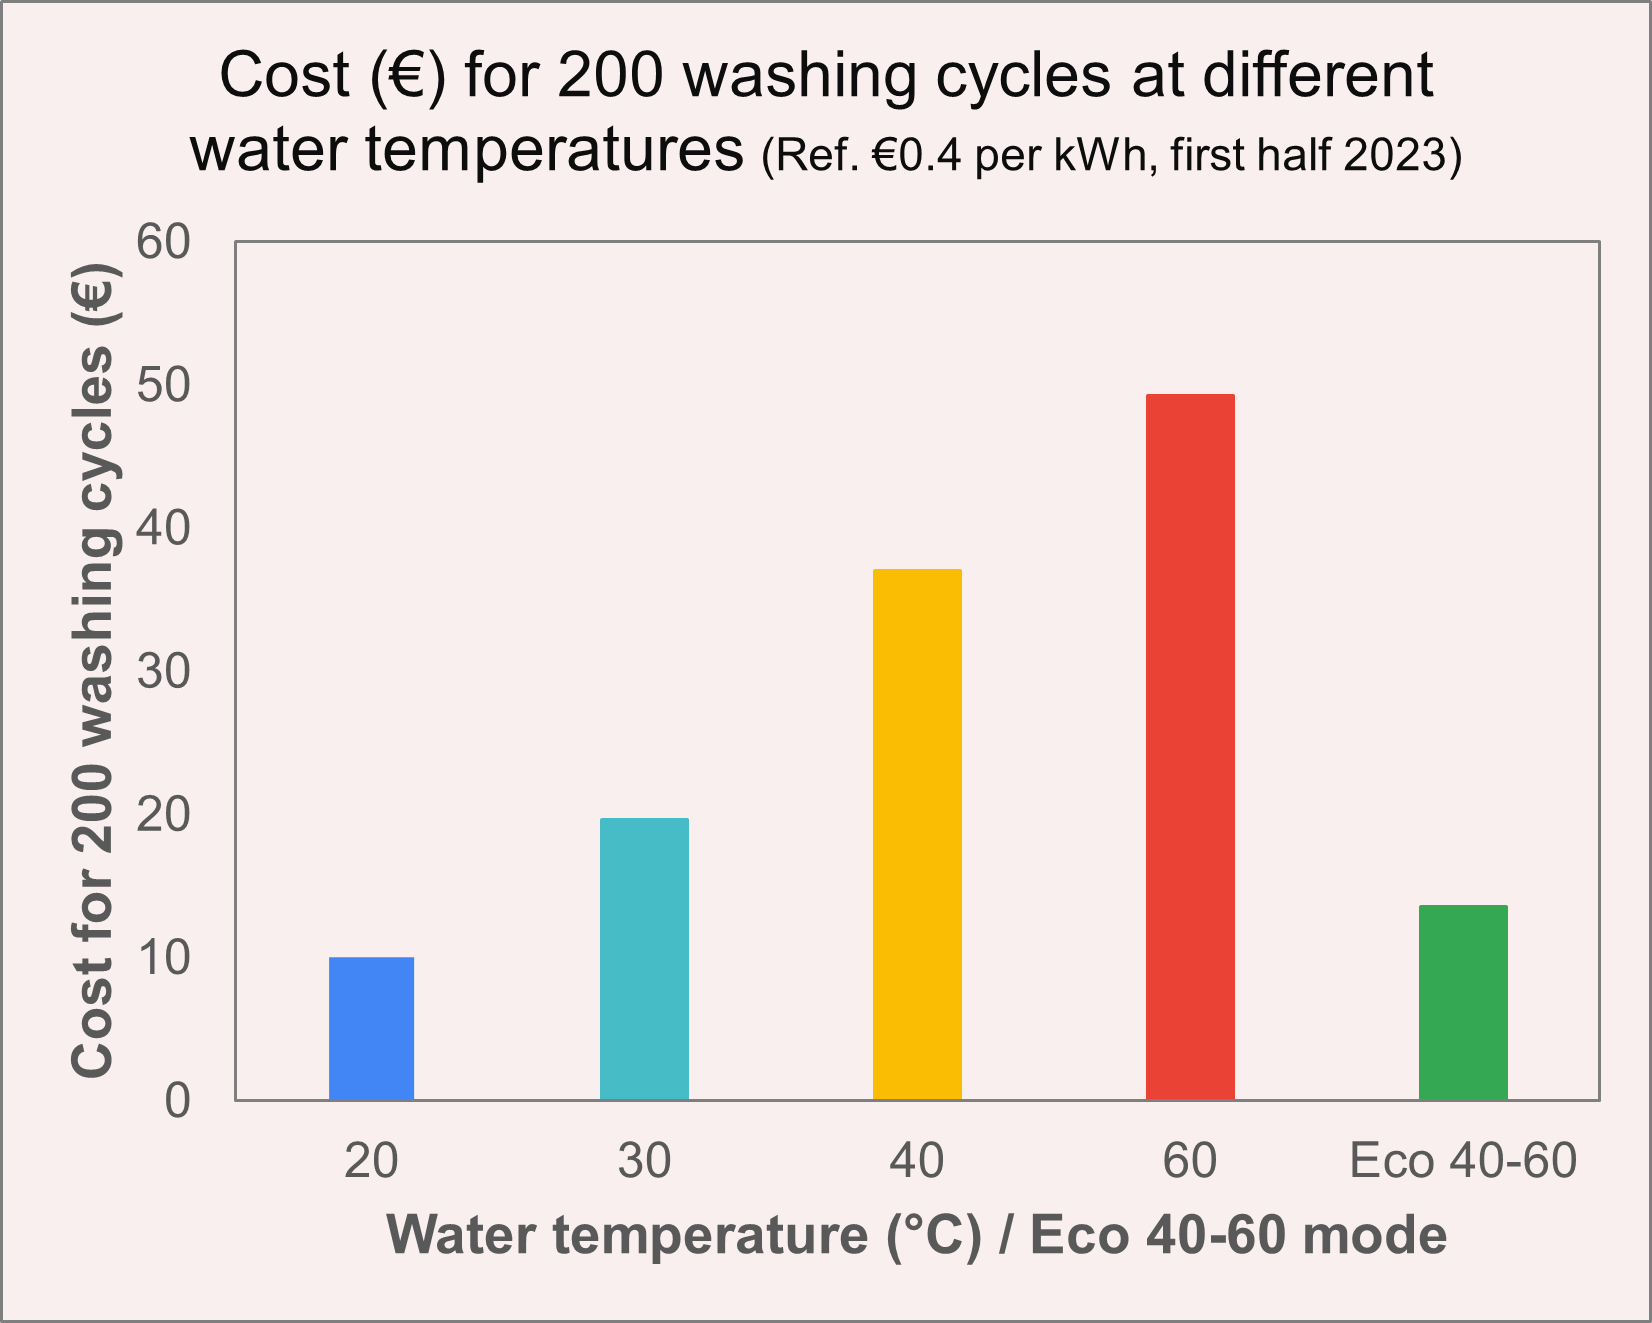
Figure 7: The graph shows the approximate cost for 200 washing cycles using the Mixed laundry mode (water temperature from 20°C to 60°C) versus the Eco 40-60 washing mode. The cost calculation assumes €0.4 per kWh usage of electrical energy, which was the approximate cost in the first half of 2023 as noted by Eurostat [13].
Conclusion and recommendation
From both ecological and economical point of view, Eco 40-60 mode is ideal for washing machines with energy rating A, because it saves on electricity and also on water [11]. This reduction in the consumption of electrical energy in Eco 40-60 mode is achieved by using lower temperature water for washes and increasing the soaking time, thereby giving a similar quality of wash as for 40°C or 60°C but at a lower cost. However, the Eco 40-60 mode does require more time to wash so if you want to have a quick wash for not-so-dirty everyday use clothes, using a 20°C cycle in Mixed laundry mode can still save on electricity.
Limitations and outlook of this study
The study took into account only the impact of electrical energy consumption for two different programs and four temperatures, however for a more detailed analysis, other program modes must be tested as well. Additionally, the impact of water consumption should also be evaluated along side electricity usage, as it is an equally critical factor. The conclusions of the study are relevant for washing machines in the similar energy label range (A and B), however for less energy efficient washing machines the study may or may not hold true, as noted by testaankoop [12]. It may be possible to further reduce the energy consumption by using a lower rotation spin speed during spin drying, however, this must be first be tested to answer if the energy reduction by reducing the spin speed is significant or not.
Acknowledgement
I would like to thank my wife for co-conducting these experiments with me.
References
- STATBEL- CPI
- Belgians pay world’s third-highest electricity bills
- Electricity Grids and Secure Energy Transitions
- Electricity & gas hit record prices in 2022
- European Union energy label
- Samsung WW91TA049TH EcoBubble
- In focus: A new generation of EU energy labels
- Energy labelling for Washing machines and washer-dryers
- Hillar energy consumption meter or electricity meter
- Medisana PS400 weighing scale (Item no.: 40455)
- Washing program Eco 40-60: how good is it?
- “Eco 40 – 60” op wasmachine is niet altijd zuiniger
- Electricity price statistics

Leave a comment